スキャルピングプラズマ | 優秀なEAが無料で使える|TRADERS-pro【トレプロ】トレーダーズプロ
スキャルピングプラズマ
プロフィットファクター
1.23
※バックテスト参考値
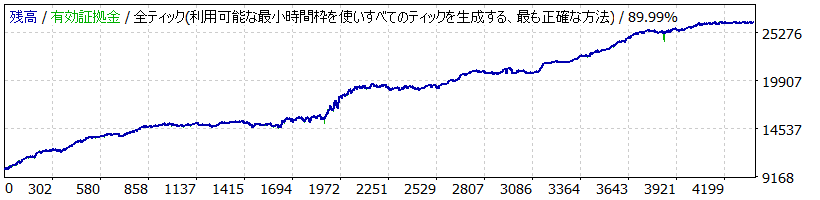
Strategy Tester Report
Plasma
XMTrading-Real 12 (Build 1090)
| Symbol | USDJPY (US Dollar vs Japanise Yen) | ||||
| Period | 5 Minutes (M5) 2007.07.09 00:00 - 2018.05.25 23:50 (2007.07.07 - 2018.05.30) | ||||
| Model | Every tick (the most precise method based on all available least timeframes) | ||||
| Parameters | MAGIC=20180429; OrderCom="Plasma"; MaxSpread=30; Lot=0.1; MaxStopLoss=0; MaxSlippage=10; MM=false; MM_Leverage=10; | ||||
| Bars in test | 806124 | Ticks modelled | 151914073 | Modelling quality | 90.00% |
| Mismatched charts errors | 0 | ||||
| Initial deposit | 1000.00 | Spread | 5 | ||
| Total net profit | 8395.98 | Gross profit | 45399.15 | Gross loss | -37003.17 |
| Profit factor | 1.23 | Expected payoff | 0.58 | ||
| Absolute drawdown | 184.43 | Maximal drawdown | 401.23 (24.25%) | Relative drawdown | 24.25% (401.23) |
| Total trades | 14413 | Short positions (won %) | 7164 (65.40%) | Long positions (won %) | 7249 (65.98%) |
| Profit trades (% of total) | 9468 (65.69%) | Loss trades (% of total) | 4945 (34.31%) | ||
| Largest | profit trade | 145.30 | loss trade | -154.30 | |
| Average | profit trade | 4.80 | loss trade | -7.48 | |
| Maximum | consecutive wins (profit in money) | 16 (42.26) | consecutive losses (loss in money) | 7 (-174.37) | |
| Maximal | consecutive profit (count of wins) | 199.96 (9) | consecutive loss (count of losses) | -174.37 (7) | |
| Average | consecutive wins | 3 | consecutive losses | 1 | |