ビッグゴールド | 優秀なEAが無料で使える|TRADERS-pro【トレプロ】トレーダーズプロ
ビッグゴールド
プロフィットファクター
1.62
※バックテスト参考値
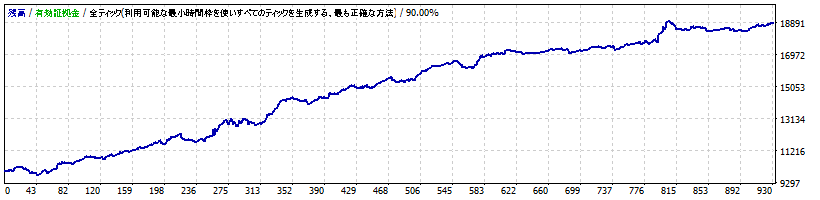
Strategy Tester Report
BigGold
XMTrading-Real 12 (Build 1090)
| Symbol | USDJPY (US Dollar vs Japanise Yen) | ||||
| Period | 5 Minutes (M5) 2007.07.09 00:00 - 2018.08.22 23:55 (2007.07.07 - 2018.08.23) | ||||
| Model | Every tick (the most precise method based on all available least timeframes) | ||||
| Parameters | MAGIC=20180823; OrderCom="BigGold"; Spread=30; Slippage=30; Lot=0.1; MM=false; MMLeverage=10; MaxStopLoss=0; | ||||
| Bars in test | 824268 | Ticks modelled | 155612274 | Modelling quality | 90.00% |
| Mismatched charts errors | 43 | ||||
| Initial deposit | 10000.00 | Spread | 5 | ||
| Total net profit | 8488.65 | Gross profit | 22076.83 | Gross loss | -13588.18 |
| Profit factor | 1.62 | Expected payoff | 1.92 | ||
| Absolute drawdown | 176.89 | Maximal drawdown | 501.15 (3.84%) | Relative drawdown | 3.84% (501.15) |
| Total trades | 4410 | Short positions (won %) | 2249 (69.90%) | Long positions (won %) | 2161 (72.33%) |
| Profit trades (% of total) | 3135 (71.09%) | Loss trades (% of total) | 1275 (28.91%) | ||
| Largest | profit trade | 67.69 | loss trade | -163.17 | |
| Average | profit trade | 7.04 | loss trade | -10.66 | |
| Maximum | consecutive wins (profit in money) | 41 (179.44) | consecutive losses (loss in money) | 16 (-97.19) | |
| Maximal | consecutive profit (count of wins) | 325.78 (11) | consecutive loss (count of losses) | -294.98 (6) | |
| Average | consecutive wins | 5 | consecutive losses | 2 | |