SingaPura USDJPY 【固定ロットとマーチンゲールを選択可能!】 | 優秀なEAが無料で使える|TRADERS-pro【トレプロ】トレーダーズプロ
SingaPura USDJPY 【固定ロットとマーチンゲールを選択可能!】
プロフィットファクター
1.81
※バックテスト参考値
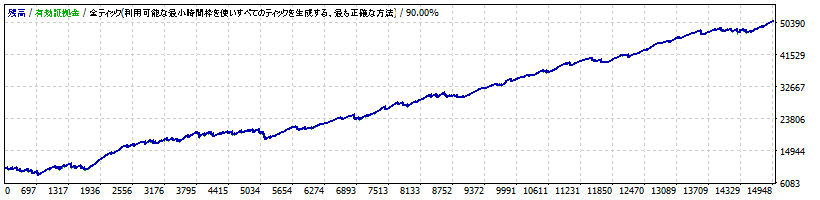
Strategy Tester Report
SingaPura UJ
TitanFX-Demo01 (Build 1090)
| Symbol | USDJPY (US Dollar vs Japanese Yen) | ||||
| Period | 5 Minutes (M5) 2005.01.17 02:45 - 2018.08.30 23:55 (2005.01.17 - 2018.08.31) | ||||
| Model | Every tick (the most precise method based on all available least timeframes) | ||||
| Parameters | MaxSpread=3; Sl=140; Tp=9; Lots=0.1; MaxLots=0.2; Lots_exp=1.2; MaxOrders=6; MAGIC=12355; | ||||
| Bars in test | 998272 | Ticks modelled | 181568230 | Modelling quality | 90.00% |
| Mismatched charts errors | 0 | ||||
| Initial deposit | 10000.00 | Spread | 15 | ||
| Total net profit | 20413.25 | Gross profit | 45611.56 | Gross loss | -25198.31 |
| Profit factor | 1.81 | Expected payoff | 3.79 | ||
| Absolute drawdown | 628.94 | Maximal drawdown | 799.71 (3.71%) | Relative drawdown | 6.41% (642.17) |
| Total trades | 5381 | Short positions (won %) | 2528 (82.16%) | Long positions (won %) | 2853 (81.14%) |
| Profit trades (% of total) | 4392 (81.62%) | Loss trades (% of total) | 989 (18.38%) | ||
| Largest | profit trade | 25.20 | loss trade | -331.67 | |
| Average | profit trade | 10.39 | loss trade | -25.48 | |
| Maximum | consecutive wins (profit in money) | 80 (662.64) | consecutive losses (loss in money) | 10 (-131.84) | |
| Maximal | consecutive profit (count of wins) | 662.64 (80) | consecutive loss (count of losses) | -408.18 (6) | |
| Average | consecutive wins | 9 | consecutive losses | 2 | |